
New United Nations Population Estimates and Projections
Written by Mary Beth Weinberger, MA | Published: September 19, 2022
On World Population Day, July 11, 2022, the United Nations Population Division released updated population estimates and projections for the world and all countries. This article describes some of the main findings, based primarily on the summary report of World Population Prospects 2022.
According to the new assessment, the world’s population will reach 8 billion on November 15, 2022. The number of people on the planet has more than tripled since 1950, when it was 2.5 billion. Although the annual rate of population growth has been declining since the early 1960s, the global population is projected to rise to 9.7 billion by 2050 and to continue increasing until it reaches 10.4 billion during the 2080s, according to the UN’s medium projections. The population is projected to remain near that level until the end of the century.[1]
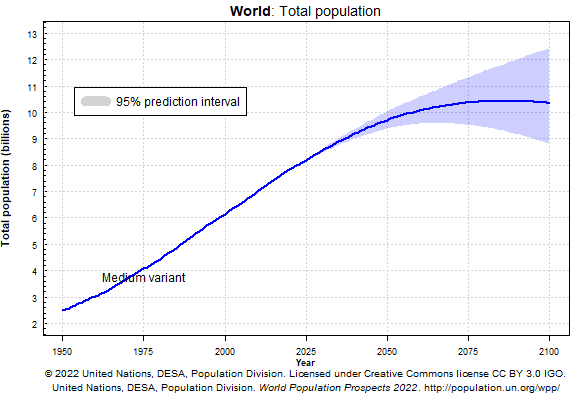
There is a wide band of uncertainty around the projected numbers for dates far in the future; the UN’s statistical analysis concludes that there is a 95 percent probability that the global population will be between 9.4 and 10.0 billion in 2050 and between 8.9 and 12.4 billion in 2100 (figure 1).[2] There is an approximately 50 percent chance that the global population will reach a peak and begin declining during the final decades of the century. However, there is nearly as great a chance that it will continue increasing up to 2100. Which of these outcomes develops will depend heavily on the pace of fertility decline in countries that only recently began the transition from high to low levels of fertility.
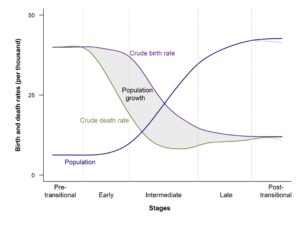
The current era of sustained population growth is the outcome of a one-time demographic transition: “the historic shift towards longer lives and smaller families that has been a universal feature of social and economic development in recent centuries” (UN 2021, preface). Figure 2 shows a schematic representation of the transition. This process began in parts of Europe during the 19th century and has since spread globally. During the transition, the decline in mortality typically begins before fertility levels start to fall, so that population growth first accelerates and later slows down once fertility levels begin declining. By 2021, all countries had begun the transition to lower levels of fertility as well as mortality. However, the timing and pace of the transition have varied greatly, and today’s countries and regions show wide differences in rates of population growth and all components of population change—fertility, mortality, and migration.
Diversity of trends
Population growth
Because of differing rates of population growth, the rank ordering of some of the largest countries and regions[3] will change in the coming decades. India is expected to surpass China to become the world’s largest country in 2023. China’s population has essentially stopped growing at 1.4 billion, and it may fall below 1 billion by 2080. India’s population growth has been slowing, but its population is projected to continue increasing until the mid-2060s, when it will reach 1.7 billion. Nigeria is projected to become the world’s third largest country in 2050, when its population will surpass that of the United States.
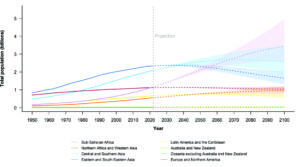
Sub-Saharan Africa will contribute most of the global population increase between 2022 and 2100, and it is likely to become the most populous region in the late 2060s (figure 3). Its population may reach 3.4 billion by 2100, when it will account for around one-third of the global population, up from 15 percent today. The populations of Oceania and Northern Africa and Western Asia are also expected to continue growing through the end of the century, though at a much slower pace than in sub-Saharan Africa. The populations of other regions—Eastern and South-Eastern Asia, Central and Southern Asia, Latin America and the Caribbean, and Europe and Northern America—are projected to reach their peaks and begin declining before 2100. Indeed, in a growing number of countries, the annual number of births has already fallen below the number of deaths, and the populations of 61 countries or areas are projected to decrease by at least 1 percent between 2022 and 2050, due to sustained low fertility and, in some cases, high rates of emigration.
Mortality
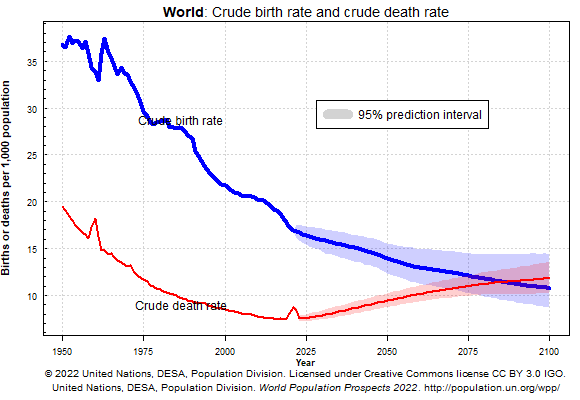
Global life expectancy at birth increased from 46.5 years in 1950 to 72.8 years in 2019, and it is projected to rise to 77.2 years in 2050 and 82.1 years in 2100. At the same time, the crude death rate (annual deaths per 1,000 population), will rise (figure 4), due to the increasing share of older age groups in the population.
Although life expectancy has risen substantially in all countries since 1950, wide disparities remain. Among regions, life expectancy in 2021 ranged from 59.7 years in sub-Saharan Africa to 84.2 years in Australia/New Zealand. For individual countries and areas, it was below 54 years in the Central African Republic, Chad, Lesotho, and Nigeria, while it was above 84 years in Australia, Hong Kong, Japan, Macao, and Monaco. These disparities are expected to narrow, but will not disappear during the remainder of the 21st century.
The Covid-19 pandemic is a reminder that a steady improvement in life expectancy cannot be taken for granted. In fact, recent decades have seen major setbacks in some parts of the world, including declines in life expectancy in the late 1980s and 1990s in parts of sub-Saharan Africa during the height of the HIV/AIDS epidemic, and in Eastern Europe during the health and economic crisis that followed the breakup of the Soviet Union. Although life expectancy later resumed rising, those setbacks have had long-lasting effects on mortality levels in the countries most severely affected.
Since the pandemic began in 2020, global life expectancy at birth is estimated to have fallen from 72.8 years in 2019 to 71.0 years in 2021.[4] Although some countries did not experience declining life expectancy during 2020-2021, in others, including Bolivia, Botswana, Lebanon, Mexico, Oman, and the Russian Federation, life expectancy decreased by four years or more. Among regions, the largest declines—over three years—occurred in Central and Southern Asia and in Latin America and the Caribbean. The risk of severe illness or death from Covid-19 is especially high for older persons and, because of its larger impact on male than female mortality, the pandemic has also slightly widened the gap between male and female life expectancy; in 2021, the global average life expectancy was 73.8 years for women and 68.4 years for men. The UN projections assume that all countries will return to their pre-pandemic levels of life expectancy between 2022 and 2025 and that life expectancy will resume its upward trend. However, the estimates of Covid’s demographic impacts were, of necessity, conducted in the midst of the pandemic and based on very incomplete data. They are sure to be revised as more complete evidence of the pandemic’s impact accumulates.
The pandemic also greatly reduced levels of international migration, as many countries temporarily closed their borders. The projections assume that net international migration will resume its pre-pandemic levels and trends within a few years. Covid-19 has had smaller and less consistent effects on fertility trends; in high-income countries, there was a short-term decline in fertility as many births were postponed, but there will probably be no longer-term impact on fertility trends.
Fertility
In 2021, the world’s average total fertility rate was 2.3 births per woman over a lifetime, less than half the level in 1950, when it was around 5 births. By 2050, total fertility is expected to decline to about 2.1 births per woman, the level at which each generation would just replace itself in a low-mortality population.
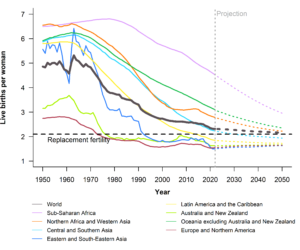
All world regions have much lower levels of fertility today than in 1950, but inter-regional differences remain large (figure 5). Total fertility is highest (4.6 births per woman) in sub-Saharan Africa and is at or above the world average in Oceania excluding Australia and New Zealand (3.1), Northern Africa and Western Asia (2.8), and Central and Southern Asia (2.3). In other regions, containing two-thirds of the global population, total fertility fell below 2 births per woman at dates ranging from the 1970s to the 2010s. Since then, total fertility in those regions has generally fluctuated between 1.5 and 2.0 births per woman, though in some countries it has fallen even lower.
A major source of uncertainty in the long-range population projections is the difficulty of predicting the course of fertility in countries where the level of fertility is still high. Countries that still have high levels of fertility generally also have low levels of per capita income, high levels of absolute poverty and hunger, low levels of education (especially for girls), and high levels of unmet need for contraception. Most such countries are in sub-Saharan Africa, and many are in the group of 46 Least Developed Countries as classified by the UN.[5] An accelerated fertility decline in those countries—beyond the decline already expected in the medium projections—could bend the trajectory of future population growth closer to the lower boundary of the prediction interval shown in figure 1. Chances of this happening would be improved by stepped-up progress towards meeting the UN’s Sustainable Development Goals (SDGs); history shows that a rapid fertility transition is most likely in the context of sustained progress in social and economic development, coupled with effective reproductive health and family planning programs that enable women to choose whether and when to give birth.
However, the last few years have pushed the world further away from achieving the SDGs. Apart from its impact on mortality and other demographic trends, the Covid-19 pandemic overwhelmed health systems and led to lengthy school closures, while the accompanying economic disruptions, now amplified by the war in Ukraine, have reversed years of progress in eradicating poverty and hunger, in improving health and education, and in providing basic services. At the same time, the world is facing the largest number of armed conflicts since 1946, while climate change is producing more frequent and more severe heatwaves, droughts, and floods (UN 2022d). In the face of these progress reversals, António Guterres, the UN Secretary-General, has called for “an urgent rescue effort for the SDGs” (UN 2022d, forward). The success of this rescue effort during the coming years will determine whether and how far the world progresses in achieving the three dimensions of sustainable development—economic, social, and environmental—for all the world’s people and for our planet.
Differences Between the 2019 and 2022 Revisions of the UN Population Estimates and Projections
There are noteworthy differences in both methodology and results between the 1999 and 2022 revisions of the UN population estimates and projections.* For the first time, the new revision of World Population Prospects presents demographic estimates and projections for single calendar years and by single years of age, instead of the 5-year groupings employed earlier. “The upgrade responds to the growing demand for annual population data to assess progress in implementing the Sustainable Development Goals (SDGs)” (UN 2022c). Preparation of the new revision involved an extensive reassessment of the data underlying the population estimates from 1950 through 2021, including a re-evaluation of the demographic impact of thousands of crises that have occurred over the period—conflicts and battles, mass killings, epidemics, and natural disasters. The 2022 revision also introduced new methods for taking account of uncertainty in past measurements of fertility and mortality and a revised approach to estimating the mortality impact of the HIV/AIDS epidemic in heavily affected countries.
New data and analyses that become available between successive revisions often lead to revised estimates for the recent past for some countries as well as revised projections for future years. According to the new revision, the world’s population as of mid-2019, which was the reference date of the 2019 revision, was 51 million (0.7 percent) larger than had been estimated in 2019, and the estimated population in mid-2021 was 34 million (0.4 percent) larger than had been projected in 2019. Among regions, the greatest absolute differences for 2021 are upward revisions for Central and Southern Asia (28 million, 1.4 percent), sub-Saharan Africa (15 million, 1.3 percent), and Northern Africa and Western Asia (11 million, 2.0 percent) and a downward revision for Eastern and Southeastern Asia (18 million, -0.8 percent) (UN 2022b).
The 2022 and 2019 revisions both project that the global population in 2050 will be around 9.7 billion, while the medium projection for 2100 is about 5 percent lower in the latest than in the previous revision (10.4 billion and 10.9 billion, respectively). However, both those numbers fall well within the 95 percent uncertainty interval for the projections.
* The methodological changes are described in an annex to the summary report on the 2022 revision and in a detailed technical report (United Nations 2022a and 2022c).
Mary Beth Weinberger, MA, worked for over 25 years as a demographer in the United Nations Population Division and was Chief of the Population and Development Section when she retired. Mary Beth has been a member of the Population Connection Board of Directors since 2019.
References
UN, 2022d: United Nations. The Sustainable Development Goals Report 2022
Endnotes
[1] Unless otherwise specified, numbers given in the text are taken from the 2022 revision of the UN estimates and medium-scenario projections.
[2] The methodology for producing the probabilistic projections and uncertainty intervals is described in the summary report (UN 2022c) and in a detailed methodological report (UN 2022a). The medium scenario can be considered “the most likely population projection based on several thousand simulated future trends, each one based on distinct trajectories of fertility and mortality for individual countries and areas. Prediction intervals reflect the spread in the distribution of outcomes across the projected trajectories and thus provide an assessment of the uncertainty inherent in the medium scenario” (UN 2022c). The simulated trajectories are based on a model that takes into account each country’s fertility and mortality trends before the start of the projection period as well as uncertainty about future trends based on the past experience of other countries when they were at similar levels of fertility and mortality. “Since these models have been calibrated using historical data on trends in fertility and mortality, an implicit assumption that underlies the medium scenario is that the pace and patterns of change in these variables will be similar in the future to what they have been in the past seventy years” (UN 2022c). Although these are not discussed here, the UN Population Division also publishes deterministic projections for various “what-if” scenarios with alternative assumptions about the future course of fertility, mortality, and migration in each country.
[3] The regional groupings employed here are those adopted for statistical reporting of progress towards achieving the UN’s Sustainable Development Goals (SDGs): Sub-Saharan Africa, Northern Africa and Western Asia, Central and Southern Asia, Eastern and South-Eastern Asia, Latin America and the Caribbean, Australia/New Zealand, Oceania (excluding Australia/New Zealand), and Europe and Northern America. See https://unstats.un.org/sdgs/indicators/regional-groups.
[4] The UN Population Division collaborated with the World Health Organization to develop estimates of mortality attributable to the direct and indirect impacts of the pandemic. The number of excess deaths associated with the pandemic is estimated to be 14.9 million for calendar years 2020 and 2021, almost three times the number officially reported (UN, 2022c).
[5] https://www.un.org/development/desa/dpad/least-developed-country-category.html