Population Education, December 2022
Written by Pamela Wasserman, Senior Vice President for Education | Published: December 12, 2022
A Classroom Simulation for 8 Billion and Growing
We’ve just reached a huge global population milestone: 8 billion. To help students better understand how we got here and where we might be headed, we use visual representations and simulations in the classroom. One such high school activity is “Where Do We Grow From Here?” which we recently updated to include the latest UN population projections. The full lesson, including printable props, can be found at WorldPopulationHistory.org. Here’s a condensed version of Part 2 (Population Growth by Region: 1800-2100).
Where Do We Grow From Here?
UN demographers expect more than 2 billion people to be added to the planet before the end of the century, and most of this growth will be in just a handful of countries. Here’s a way to show where population growth has happened and where it will likely occur in the future.
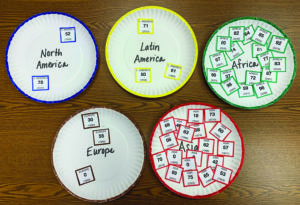
 The lesson includes 44 counting cards and five paper plates. Each plate is labeled with the name of a UN World Region and outlined with the color found on that region’s counting card: Africa (green), Asia (red), Europe (brown), Latin America (blue), and Northern America (orange). Note: Oceania isn’t included because its population is too small to be accurately represented in the simulation.
- Arrange the paper plates on a table or set of desks. Distribute the 44 counting cards (many students will get two cards). Each card represents 250 million people. Have students gather around the table/desks where you have placed the labeled paper plates.
- Explain that you will all be traveling through time from 1800 to 2100 to see how population has grown, and will grow, during that 300-year period. The time travel will be represented by counting from 1 to 100, and with every number recited, three years will pass. So when the group reaches 100, all 300 years will have elapsed and you will be in the year 2100.
- When a card’s number is reached, that student should place the card onto the plate indicated by the world region listed on the card. Each additional card on the plate represents an increase in the region’s population. The one exception is card 94, which should not be added to a plate. Instead, the student with this card will remove a counting card from Europe when counting reaches 94 (in the year 2082).
- Ask the four students holding cards with the number “0” to place these cards on the respective plates to begin the simulation (there will be three on the Asia plate, and one will be on the Europe plate). Explain that these cards represent the global population in the year 1800 when population first reached 1 billion. While people lived in every region in 1800, Asia and Europe were the predominant population centers at the time.
- As a group, start counting at a comfortable pace. Stop when you reach 74, which corresponds to present day (2022). Have the students share observations about the population distribution in 2022. What is the global population? What region is most populated? What region is growing the fastest? The slowest?
- Continue counting to 100. With the simulation completed, have the students share observations about the population distribution in 2100 and go over the discussion questions.
Discussion Questions:
- What is the total projected global population in 2100?
- Based on the simulation, the total global population in 2100 is projected to be about 10.5 billion (42 cards x 250 million per card = 10.5 billion). The UN’s projection for 2100 is 10.4 billion people.
- By the end of the simulation, which two regions are the most populated? What are those regions’ projected populations in 2100?
- Asia is the most populated, with 20 cards representing 5 billion people. This is followed by Africa, with 15 cards representing 3.75 billion people.
- Which region is growing the fastest and will add the most people between now and 2100?
- Africa. The continent is expected to add about 2.5 billion people by the end of the century. Most of this growth will be in sub-Saharan African countries.
- What are some of the challenges for the least developed countries that will experience the greatest future population growth?
- Least developed countries lack the infrastructure to provide for a rapidly growing population, including employment, transportation, education, health care, energy, housing, clean water, and sanitation. In addition, they may lack the ability to grow or import adequate food supplies.
The full lesson plan includes an analysis of the UN’s projection graphs and fertility scenarios and independent research on organizations working to address the challenges that keep fertility rates high in some of the least developed countries of the world (e.g. barriers to girls’ education, family planning services, and health care to reduce child mortality).
Other Ways PopEd Is Marking the 8 Billion Milestone:
- 8 billion themed teacher webinars and workshops
- Blogs explaining the milestone and the UN projections
- World of 8 Billion international student video contest (submissions due February 2023—see Worldof8Billion.org)
- Two new classroom posters—a revised world population map and a timeline wall chart of world population history
- Bookmarks showing all of the population milestones to date
