Global food production causes enormous environmental damage, from habitat destruction to water shortage, greenhouse gas emissions, and pollution. A major new analysis reveals how much different food types and areas contribute to our collective food footprint.
The Green Revolution and rapid global expansion of food production averted millions of deaths by starvation, but it came at a high cost to the environment. Already half of all habitable land is used for farming, making this the primary cause of deforestation and biodiversity loss, and agriculture accounts for 70% of freshwater withdrawals worldwide. Overfishing represents the biggest threat to marine ecosystems. Our food systems are also a leading driver of climate change, responsible for a third of all greenhouse gas emissions, while fertilizer and manure runoff from farms pollutes water bodies and creates harmful algal blooms.
With our population expected to exceed 10 billion in the latter half of this century and food production (especially of meat and dairy) ramping up to meet growing demand, many of these problems are likely to become more severe. Different foods vary widely in their environmental footprints, however, and some areas are under much higher pressure from food production than others.
This new study, published in the journal Nature Sustainability, provides a detailed analysis of how much different food types and areas contribute to our global food footprint. The authors examined nearly 99% of all terrestrial, marine and freshwater food production as reported to the United Nations in 2017.
Population size and diets key
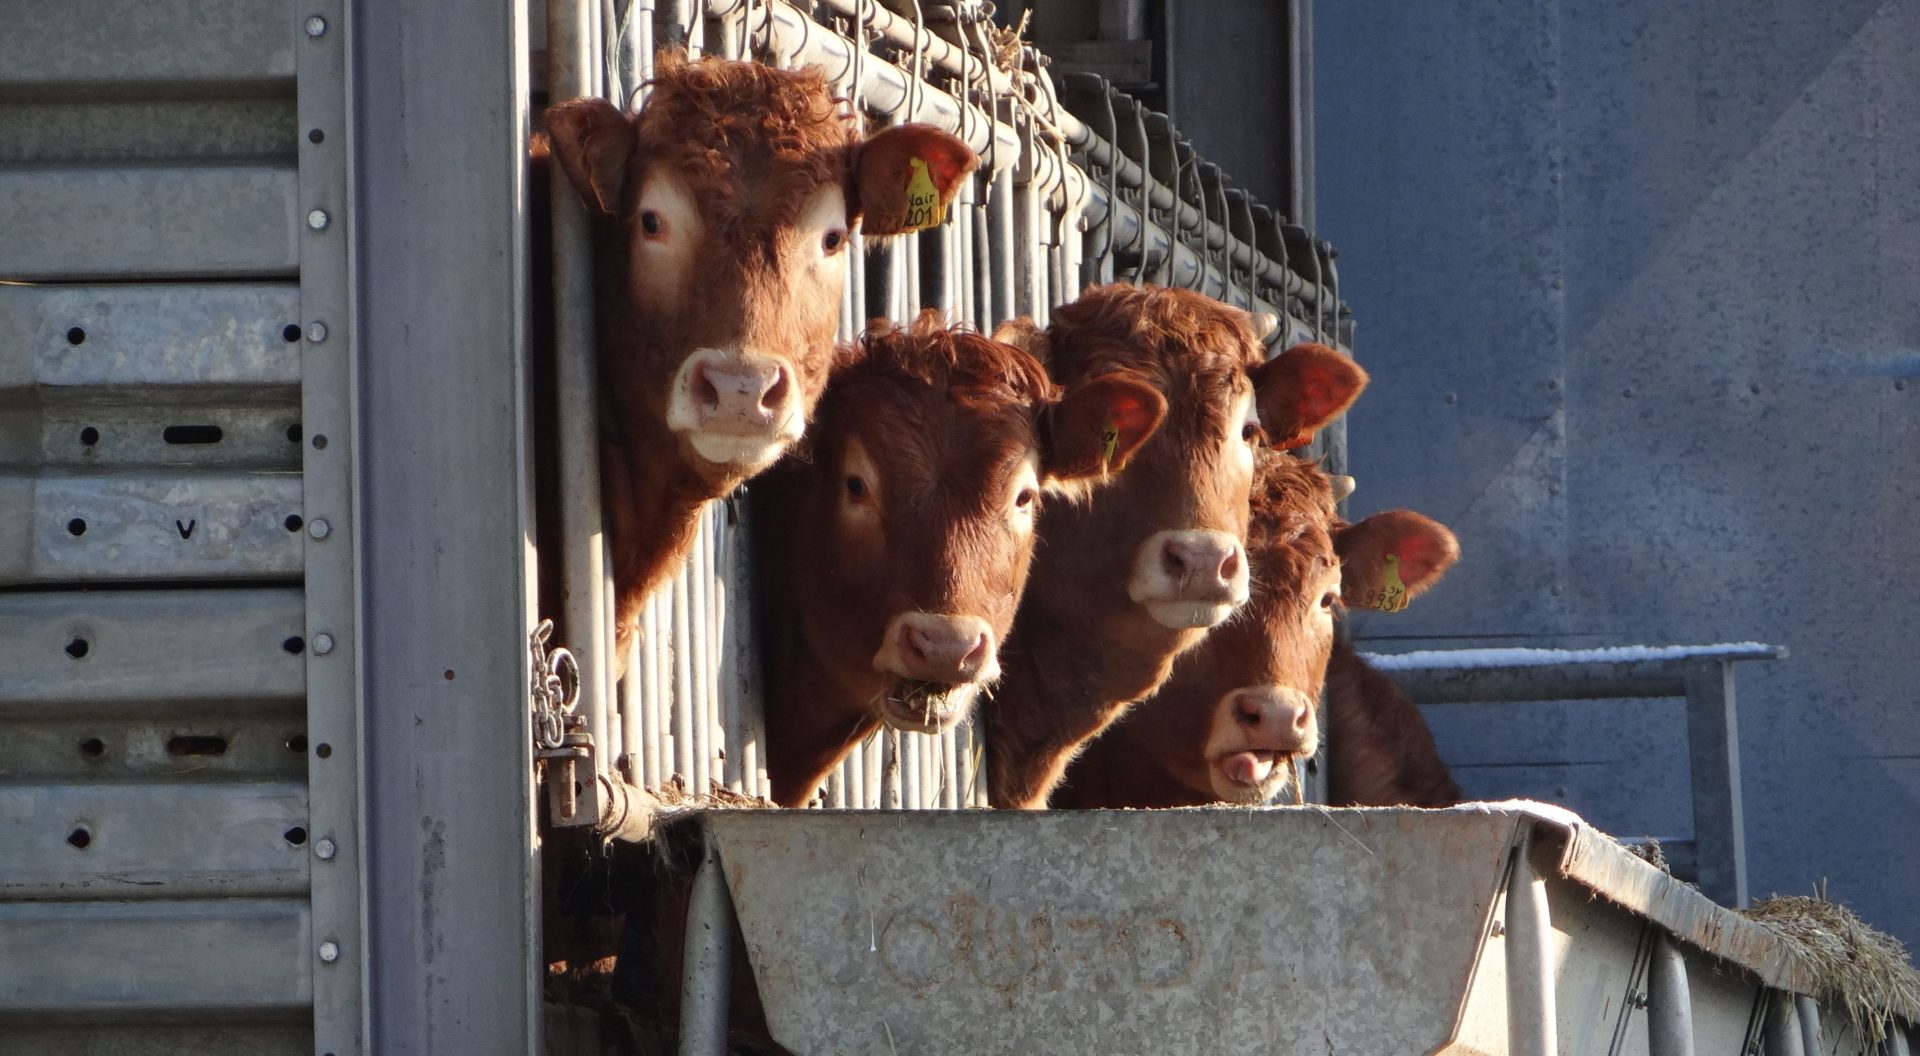
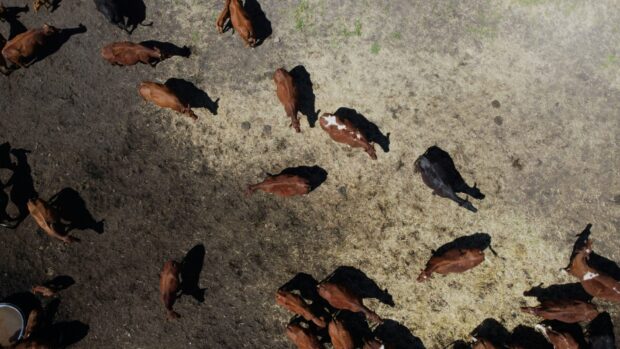
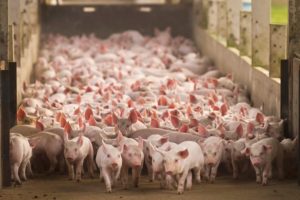 They found that just five “high-population” countries—India, China, the United States, Brazil and Pakistan—are responsible for almost half (44%) of global cumulative pressure. The most environmentally damaging foods are pork, beef, rice and wheat, but not for all the same reasons. Pigs produce a large amount of manure, so most of their footprint is due to pollution, while cattle (as ruminants) are a significant source of greenhouse gas emissions—especially of methane, a gas that is 25 times more potent than carbon dioxide. Emissions account for 60% of beef’s cumulative pressures. The large footprint of rice and wheat crops mostly reflects the enormous amount of water that goes into them, as well as their displacement of wild species.
Importantly, the calculations reflect the total global production of each food type. Demand for wheat is high as it’s a staple carbohydrate across North America and Europe, while rice is an important part of people’s diets in most of Asia.
China is the largest country-level consumer of meat, especially pork, which contributes to its large footprint. Pigs are raised on soybeans, so China is also the largest importer of soybeans in the world. The study points out that 152 of 172 countries with trade data report importing food, meaning that they displace at least some portion of their environmental pressures to other countries. For example, a previous study found that 43% of 2017 deforestation emissions from soybean cultivation in Brazil could be attributed to imports into China.
Another paper published in Nature Sustainability this year stated,
“Satisfying China’s food demand without harming the environment is one of the greatest sustainability challenges for the coming decades.”
Of course, the same can be said for the U.S., which has the highest per capita meat consumption among OECD countries. Rather than trying to satisfy this unsustainable demand, we should aim for dietary shifts towards less environmentally damaging foods.
Other findings
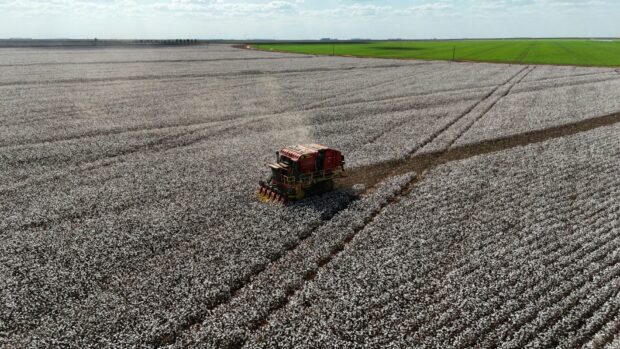
Crop production, for animal feed and for human consumption, dominates overall environmental pressure from food production in almost all countries, except for a few exceptions such as Brazil, which also has high cumulative pressure from cattle ranching.
Aquatic systems currently produce only 1.1% of all food but are responsible for 10% of the total global food footprint, demonstrating the destructiveness of global fishing operations.
There is variation between areas even within a single food type due to differences in production methods. For example, the U.S. (the largest soy producer, largely for livestock feed) is 2.4 times more efficient than India at producing soy because U.S. farmers have access to technologies that reduce emissions and increase yields. China and Brazil are 1.5 and 1.9 times less efficient, respectively, than Russia at harvesting fish that live near the ocean floor, primarily because they rely heavily on destructive bottom-trawling.
Time to stop eating the planet
The authors warn that “minimizing the environmental footprint of feeding nearly eight billion people is among the most important of societal challenges and will require strategies operating at both local and global scales.” They repeat the call of many previous scientific studies calling for transformative change:
“There is an urgent need to shift food systems towards food types, locations and production methods that can feed a growing, and increasingly wealthy, human population while reducing environmental degradation and enhancing food security.”
Despite the study’s findings that environmental pressures from food production are largely a result of diets and population size, the study does not propose action to slow human population growth. Population stabilization through the removal of barriers to family planning and education is essential in order to end hunger without exacerbating our environmental crises, and should form an integral part of efforts to fix our broken food systems.